SP500 LDN TRADING UPDATE 13/2/26

SP500 LDN TRADING UPDATE 13/2/26
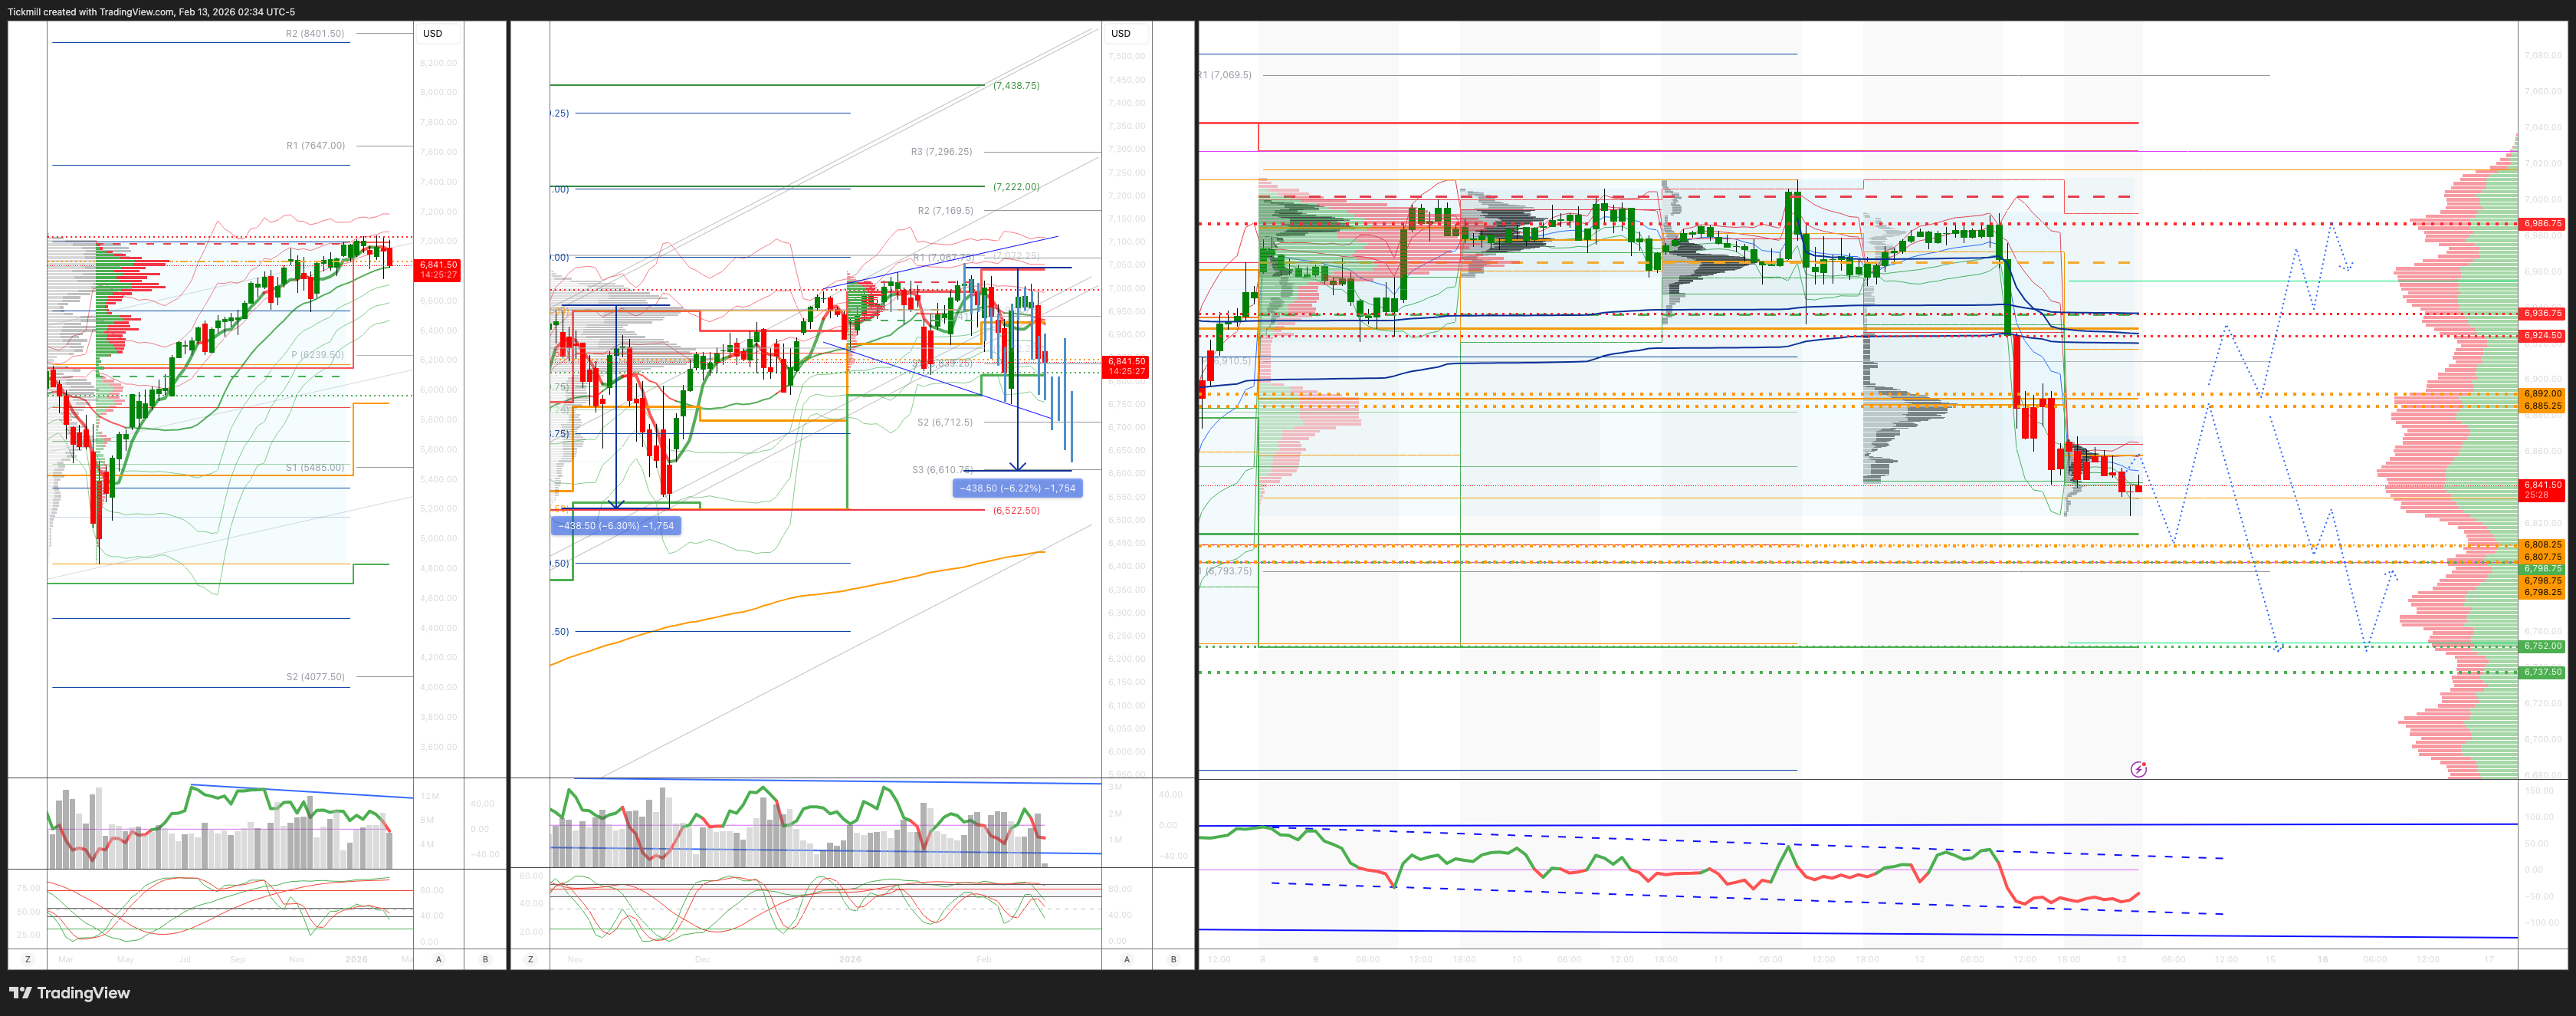
WEEKLY & DAILY LEVELS
***QUOTING ES1! FOR CASH US500 EQUIVALENT LEVELS, SUBTRACT POINT DIFFERENCE***
WEEKLY BULL BEAR ZONE 6900/6890
WEEKLY RANGE RES 7059 SUP 6847
FEB OPEX STRADDLE 6726/7154
MAR QOPEX STRADDLE 6466/7203
DEC 2026 OPEX STRADDLE 5889/7779
DAILY VWAP BEARISH 6925
WEEKLY VWAP BEARISH 6967
MONTHLY VWAP BULLISH 6901
DAILY STRUCTURE – ONE TIME FRAMING LOWER - 6992
WEEKLY STRUCTURE – BALANCE - 7031/6801
MONTHLY STRUCTURE – TBC
GAMMA FLIP 6978
DAILY BULL BEAR ZONE 6880/90
DAILY RANGE RES 6928 SUP 6798
2 SIGMA RES 6986 SUP 6737
VIX BULL BEAR ZONE 20
PUT/CALL RATIO 1.4 (The numbers reflect options traded during the current session. A put-call ratio below 0.7 is generally considered bullish, and a put-call ratio above 1.0 is generally considered bearish)
TRADES & TARGETS
SHORT ON REJECT/RECLAIM DAILY BULL BEAR ZONE TARGET DAILY RANGE SUP
LONG ON REJECT/RECLAIM OF RANGE SUP TARGET DAILY BULL BEAR ZONE
(I FADE TESTS OF 2 SIGMA LEVELS ESPECIALLY INTO THE FINAL HOUR OF THE NY CASH SESSION AS 90% OF THE TIME WHEN TESTED THE MARKET WILL CLOSE ABOVE OR BELOW THESE LEVELS)
GOLDMAN SACHS TRADING DESK VIEW - ‘Nowhere To Hide’
S&P closed down 157bps at 6,833 with a MOC of $170M to sell. NDX fell 204bps to 24,688, R2K dropped 201bps to 2,616, and the Dow declined 134bps to 49,452. Trading volume was elevated, with 22.52B shares exchanged across all U.S. equity markets, compared to the YTD daily average of 19.61B shares. VIX surged +17.96% to 20.82, WTI Crude fell 277bps to $62.84, the U.S. 10YR yield dropped 7bps to 4.10%, gold tumbled 319bps to $4,922, DXY edged up 10bps to 96.93, and Bitcoin slipped 15bps to $65,652.
Market sentiment was grim, with a "sell now, ask questions later" mentality dominating. The downside momentum accelerated without a clear catalyst, though fears surrounding AI's impact on various sectors weighed heavily. A Financial Times article quoting Microsoft’s AI CEO predicting most white-collar jobs could be replaced by AI within 12 months added to the anxiety, particularly with claims that AI models are coding better than humans. CHRW in Transports suffered an 8-sigma drop, amid concerns it could face medium-term challenges from AI-driven efficiencies, such as chatbots matching loads and reducing headcount. The sharp declines across sectors eroded sentiment further, with few willing to step in and defend positions (e.g., CBRE's intraday reversal despite solid earnings).
Technicals were also in focus, with the SPX breaking below its 50-day moving average (6,895) and breaching the CTA short-term threshold (6,911). We estimate CTAs could sell $1.5-2B of U.S. equities over the next week. The S&P remains ~110 handles above the medium-term threshold of 6,723, which, if breached, could significantly increase selling pressure. Hedge Fund VIPs outperformed Most Short by +1% today, driven by gains in the short leg.
Activity levels on the trading floor were moderate, rated a 6/10 overall, though high inbound flows pushed this to a 9/10. Both Hedge Funds (HFs) and Long-Only (LO) investors were net sellers, with ~$1B in outflows. HFs actively managed short books, while Asset Managers continued their YTD trend of rotating from tech to cyclicals and defensives, favoring Industrials, Staples, Utilities, REITs, and Energy. Utilities saw the strongest buy skew since November, ranking in the 95th percentile on a 52-week basis. Conversely, Financials and REITs experienced heavy selling, ranking in the 89th and 96th percentiles, respectively.
Looking ahead, tomorrow's key focus will be U.S. CPI data for January and earnings reports from AAP, MMI, MRNA, SXT, and WEN. For CPI, we forecast a 0.33% increase in core CPI for January (vs. +0.3% consensus), equating to a 2.52% year-over-year rate (vs. +2.5% consensus). Headline CPI is expected to rise 0.24% (vs. +0.3% consensus), reflecting higher food prices (+0.45%) but lower energy costs (-1.3%). Our projections align with a 0.31% increase in core PCE for January.
In derivatives, SPX/NDX/RUT volatility was broadly bid, particularly in the front end. SPX skew flattened dramatically at the front but saw bids further along the curve. Similar, though less pronounced, movements were observed in Nasdaq and Russell skew. VIX volatility stood out, being more aggressively bid compared to other indices. Flow activity was quieter than expected given the index moves, with flows primarily categorized as hedging near the lows and monetization near the highs. There was a slight bias toward buying options, suggesting concerns that a rally could trigger a major reset in volatility. The straddle for tomorrow priced at 93bps.
Disclaimer: The material provided is for information purposes only and should not be considered as investment advice. The views, information, or opinions expressed in the text belong solely to the author, and not to the author’s employer, organization, committee or other group or individual or company.
Past performance is not indicative of future results.
High Risk Warning: CFDs are complex instruments and come with a high risk of losing money rapidly due to leverage. 69% and 73% of retail investor accounts lose money when trading CFDs with Tickmill UK Ltd and Tickmill Europe Ltd respectively. You should consider whether you understand how CFDs work and whether you can afford to take the high risk of losing your money.
Futures and Options: Trading futures and options on margin carries a high degree of risk and may result in losses exceeding your initial investment. These products are not suitable for all investors. Ensure you fully understand the risks and take appropriate care to manage your risk.
Patrick has been involved in the financial markets for well over a decade as a self-educated professional trader and money manager. Flitting between the roles of market commentator, analyst and mentor, Patrick has improved the technical skills and psychological stance of literally hundreds of traders – coaching them to become savvy market operators!